EUR/USD technical analysis is a key tool for forex traders who want to make informed decisions based on price action. Unlike fundamental analysis, which focuses on economic data and news, technical analysis studies past price movements and patterns to predict future behavior.
In this guide, you’ll learn how to read the EUR/USD chart using essential tools like trendlines, support and resistance, and indicators.
Understanding the Basics of EUR/USD Technical Analysis
Technical analysis assumes that all relevant information is already reflected in the price. Traders use charts to identify recurring patterns and key levels to enter or exit trades.
The most commonly used chart types for EUR/USD analysis include:
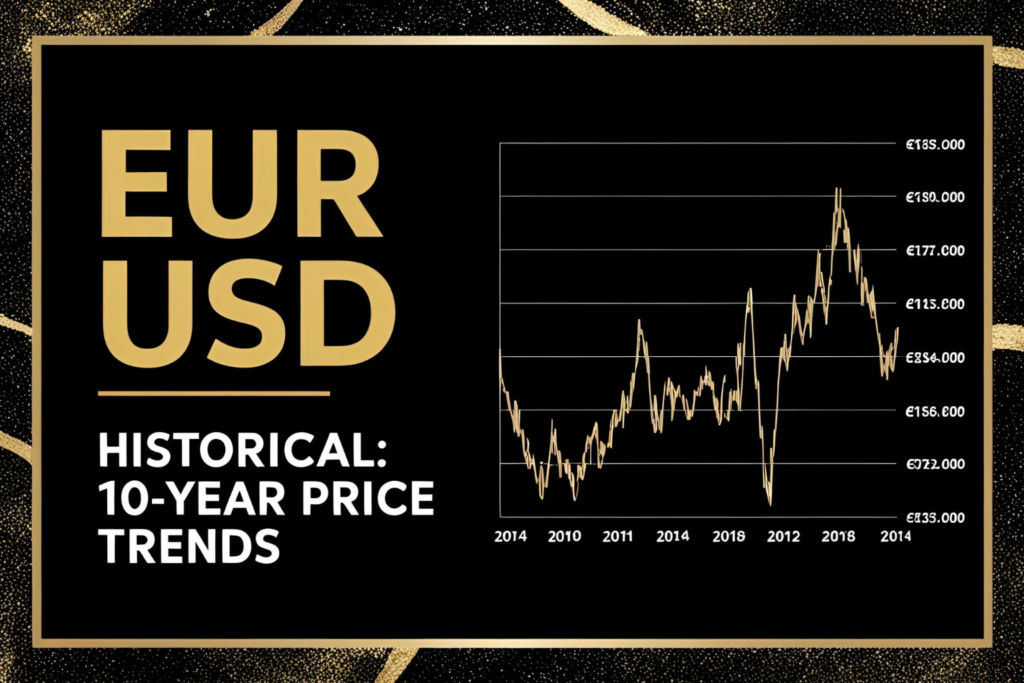
- Line chart: Shows closing prices over time, best for clarity.
- Bar chart: Displays open, high, low, and close for each period.
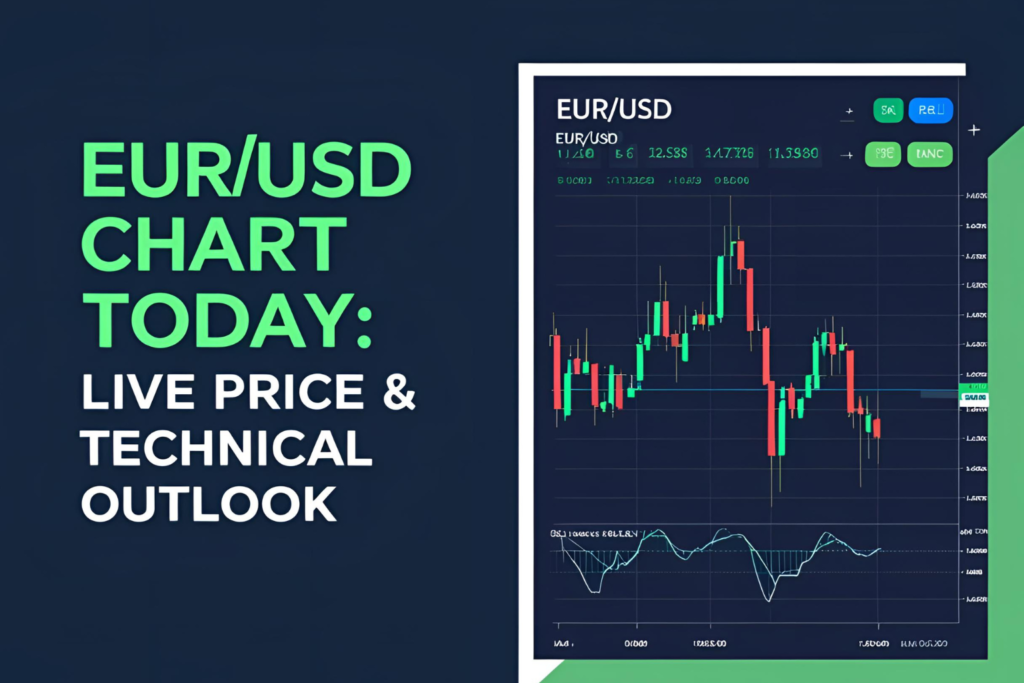
- Candlestick chart: Offers visual detail and is the most used format in forex trading.
Core Components of EUR/USD Technical Analysis
1. Trendlines
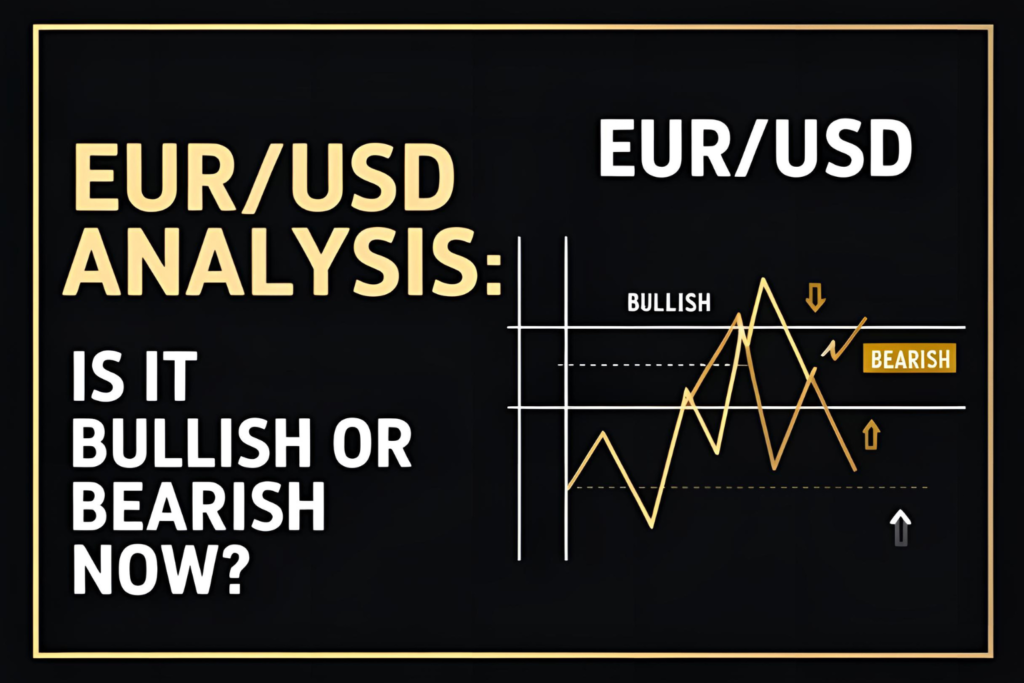
Drawing trendlines helps determine the market direction. An uptrend shows higher highs and higher lows, while a downtrend shows lower highs and lower lows.
2. Support and Resistance Levels
Support is a price zone where the pair tends to stop falling. Resistance is where it typically stops rising. These levels are important for planning entries and exits.
3. Moving Averages
Use simple moving averages (SMA) or exponential moving averages (EMA) to smooth price data and identify the overall direction. Common settings are the 50-period and 200-period MAs.
4. Indicators
Key indicators include:
- Relative Strength Index (RSI): Measures momentum and overbought/oversold zones
- MACD (Moving Average Convergence Divergence): Identifies trend reversals
- Bollinger Bands: Measures price volatility and potential breakouts
5. Chart Patterns
Watch for classic patterns like:
- Head and shoulders
- Double top or double bottom
- Triangles and channels
These patterns often signal upcoming price moves or trend reversals.
Step-by-Step Guide to Analyzing EUR/USD
- Start with a higher timeframe (daily or 4-hour) to find the overall trend
- Mark key support and resistance levels
- Draw trendlines and identify any chart patterns
- Add indicators like RSI and MACD for confirmation
- Drop to a lower timeframe (1H or 15M) for trade entry timing
Combining these tools increases the probability of accurate decisions.
Why Technical Analysis Works for EUR/USD
EUR/USD is a highly liquid and widely traded pair. This makes it responsive to technical patterns and levels. Many traders around the world watch the same signals, which adds to their effectiveness.
Frequently Asked Questions (FAQs)
1. What is the best indicator for EUR/USD technical analysis?
Popular choices include RSI, MACD, and moving averages. A combination works best.
2. Which timeframe is best for EUR/USD chart analysis?
Use higher timeframes like daily or 4-hour to determine trend, and lower timeframes like 15M for entries.
3. Can I trade EUR/USD using only technical analysis?
Yes, many traders use pure technical setups, though combining it with basic fundamentals is ideal.
4. What patterns should I look for on the EUR/USD chart?
Look for double tops, triangles, head and shoulders, and breakouts.
5. How do I know when the trend is changing?
Watch for breakouts of trendlines, moving average crossovers, or momentum shifts on RSI or MACD.


